If I missed a live game I cared about, the next thing I do is checking game stats on Google. A stats sheet tells part of the game story, which player has the most points, the total team rebound, and field goal percentage might justify the game result.The team like Houston Rockets builds its roaster and game strategy heavily relies on data, instead of traditional basketball sense, its success in the past few years not only changed how the league is playing but also shows the power of data.
Following the Lakers won the 2020 NBA champion (Congrats LeBron!), I’ll review some advanced data for season 2019-2020. Trying not to be blinded by the normal stats like points/rebounds/assists per game, the series expects to describe players from multiple perspectives and provides data proves that can support or change your opinions. All the data comes from basketball reference
Let’s start with the guards!
There are 234 guards(both PG and SG) out of total of 529 players. Some guards’ playing minutes are too few to produce any meaningful result. I’ll filter it out.
The following two figures show the game played and total minutes played distribution for all players of season 2019-2020. For example, there are 60% of player’s total playing minutes below 1000 minutes, and 40% of players played less than 500 minutes (which is averaging less than 10 mins per game) for the whole season. 60% of players played less than 50 games, around one-third of players played less than 20 games.


Based on games and minutes played distribution, only players with 50 games appearance and a total of 800 minutes (20 minutes per game for 40 games) are under the radar for analysis. 109 guards survived.
NBA advanced stats are the primary data I use for the overview, these stats consider more aspects like the pace of the game, total possessions, and contribution to success instead of just taking average points or rebounds to evaluate a player. The advanced data could be treated as standardized stats like PER measures player’s per-minute performance, WS counts players’ contribution to team success.
Let’s see some advanced stats!
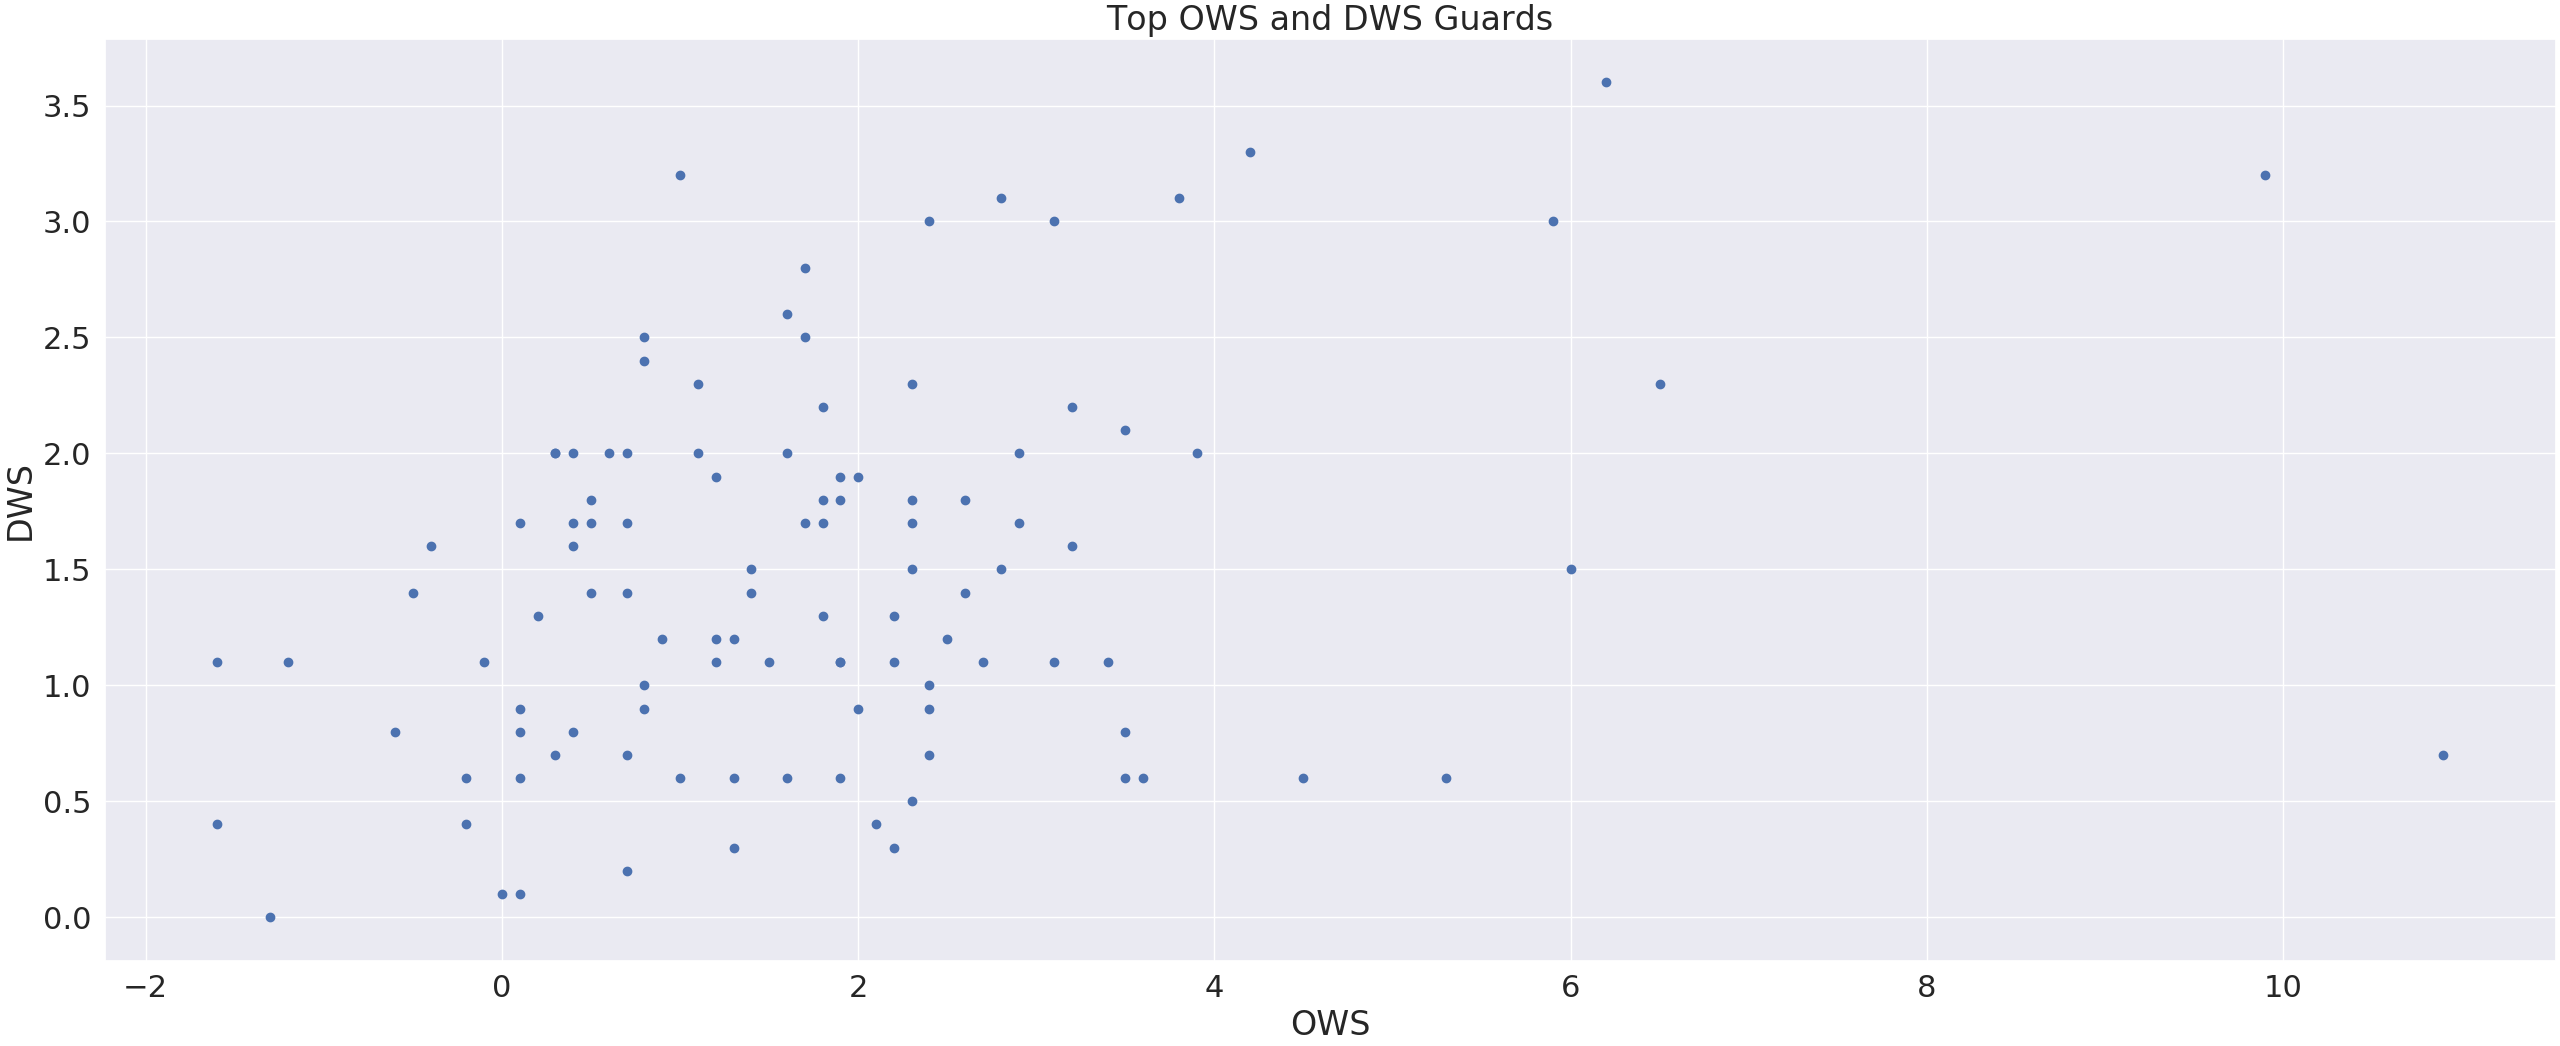
Each dot in the above figure presents a player with x axis showing the player’s offensive win share and y axis presents player’s defensive win share. For example, the player with point around (10.5, 0.7), it means this player contributed a total of 11.2 wins to the team, and 10.5 out of 11.2 are contributed by his offense. The player in the left bottom corner (-1.0, 0.0) contributed negative to the team, without who the team can win one more game. Thus the right up corner player with around 10.0 and 3.2 win shares offensively and defensively probably the most important guy to his team. We are going to find out who he is.
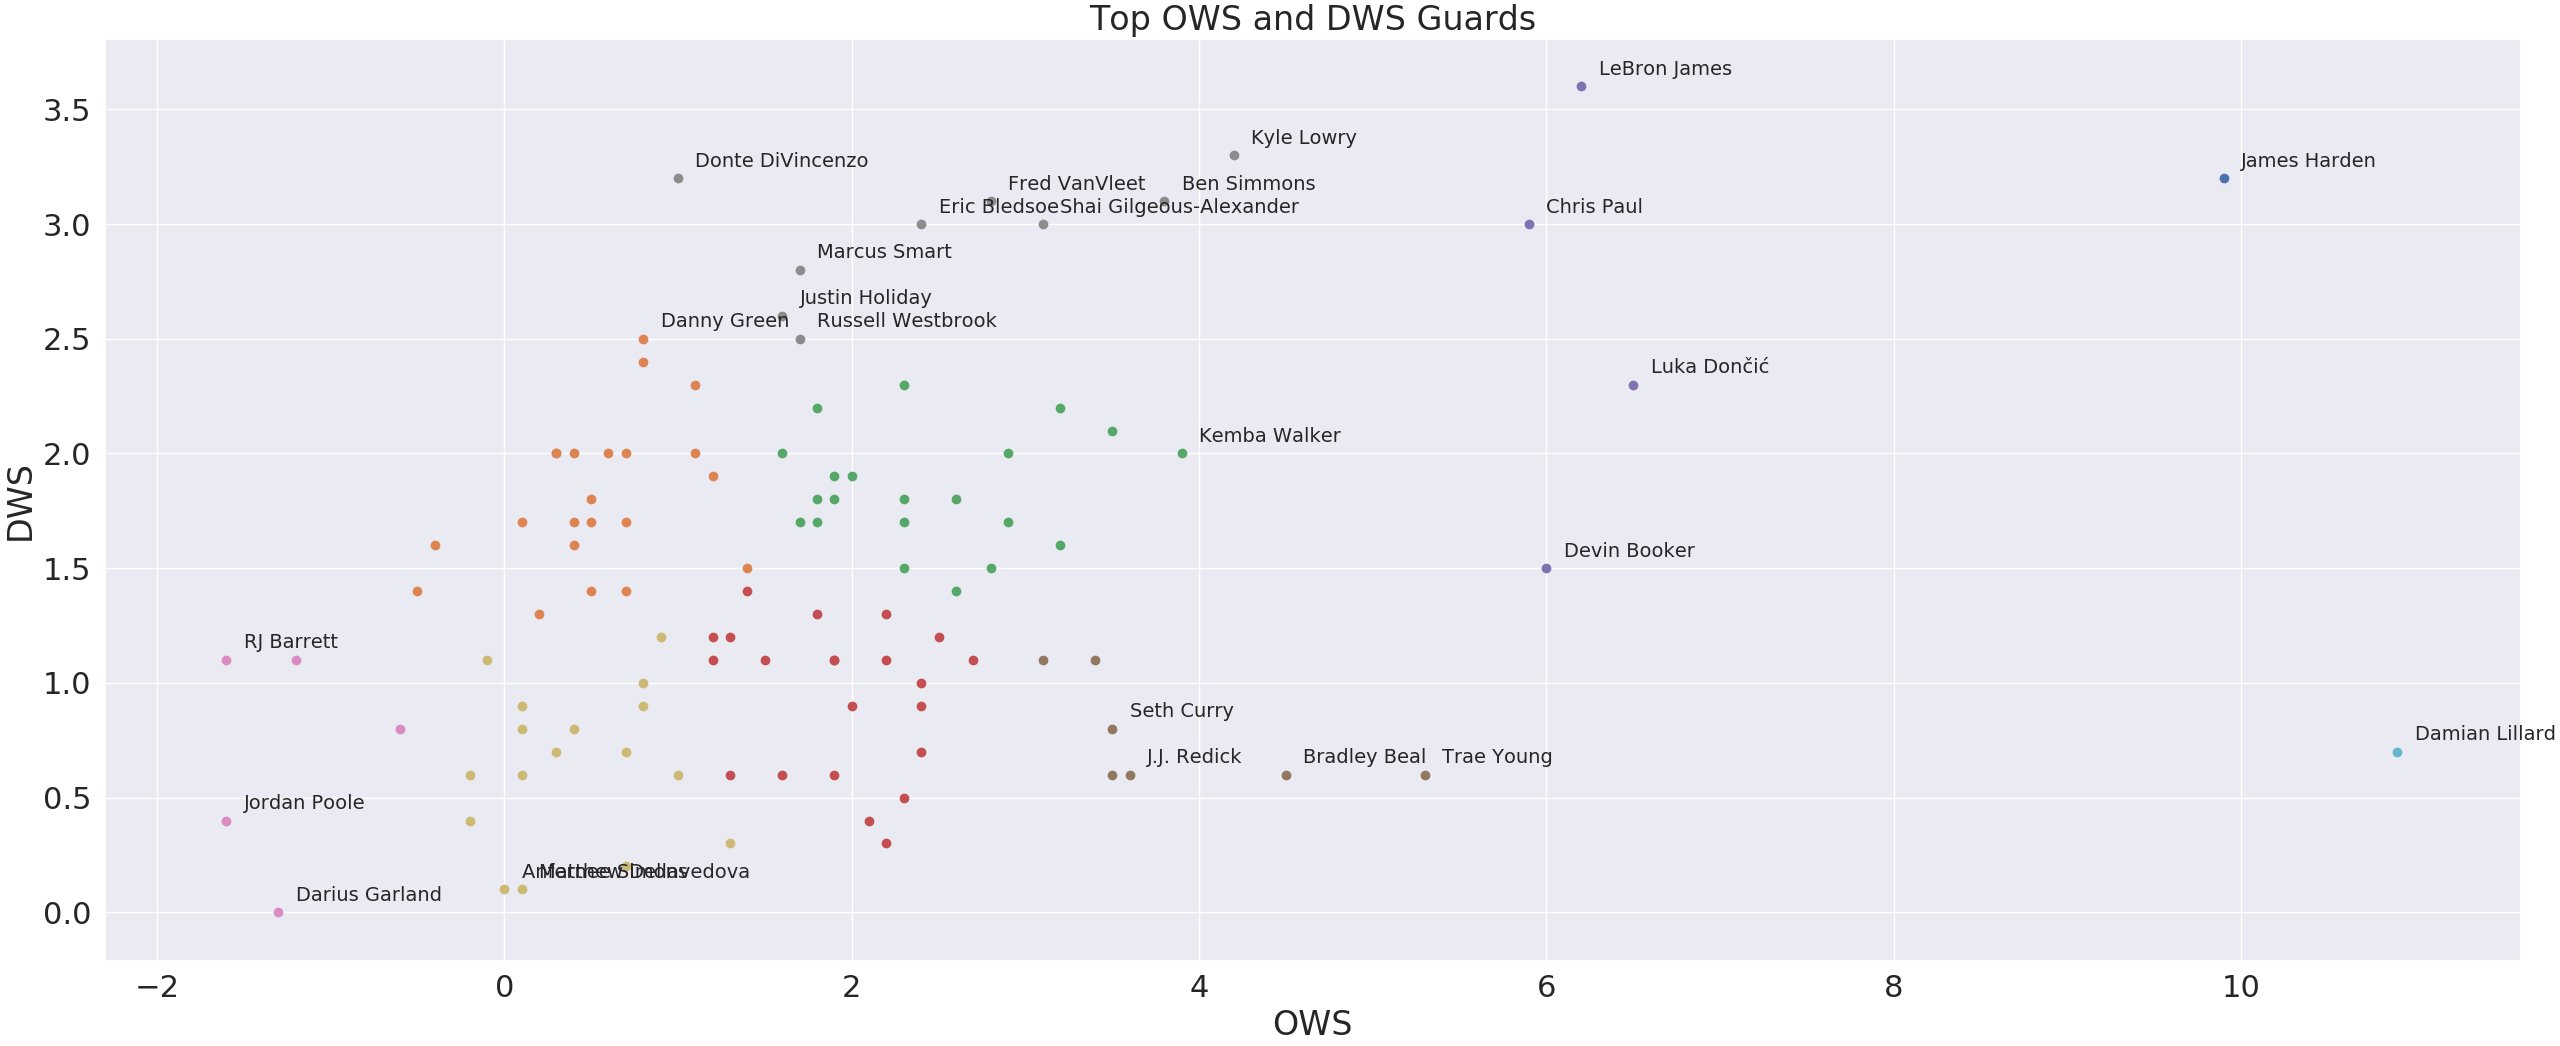
James Harden!
People won’t doubt how important James Harden is to the Rockets, but no one will imagine James Harden’s defense will add Rockets 3 wins. The color of the dot presents the clustering result, which basically means which players are more likely to be the same type of players in terms of win shares. The clustering is done on normalized data using KMEAN or GuassianMixture model. James Harden and Damian Lillard have their own group. Nobody else is comparable with them. There are several groups like Seth Curry, JJ. Redick, Bradley Beal, and Trae Young group presents an overall good offense, Kyle Lowry, Ben Simmons group have similar offensive win share but contribtues more on the defense side. Group LeBron, Chris Paul, Luka Doncic, and Devin Booker performance better in the offense than the previous group, but far less win shares than James Harden. Here I would argue Devin Booker could be a separate group since his defensive win share is just too low.
Not everyone’s contribution can lead to a win, some players might help the team, but not enough to get a win. We can use Box Plus/Minus(BPM), which is a stats to estimate a player’s contribution in points above league average per 100 possessions played.
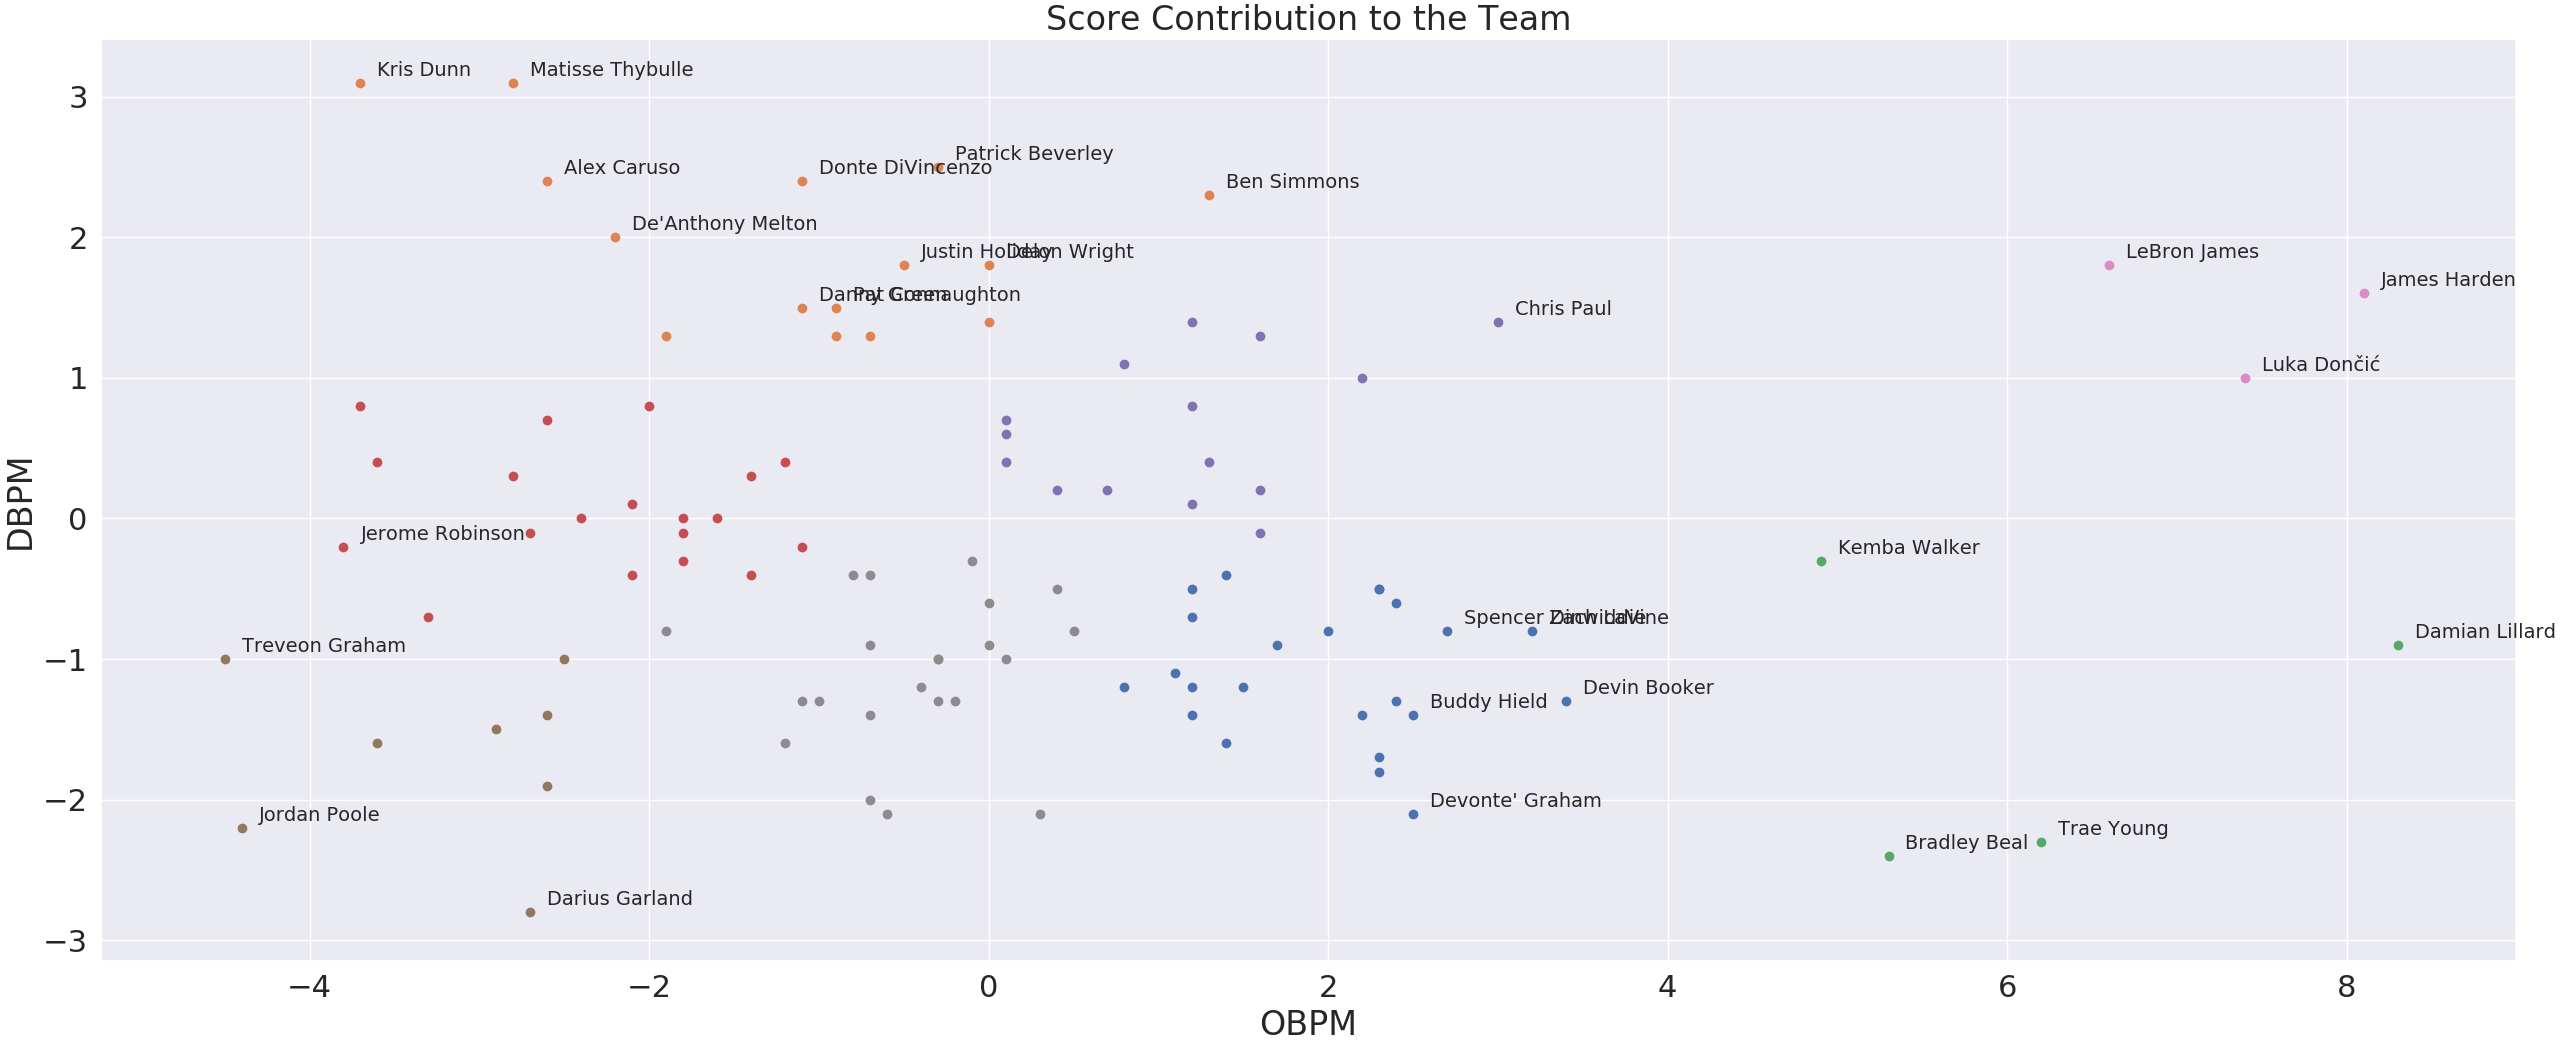
Luka, Lebron, and James are ine the elite group. Trae, Bradley, Damian, and Kemba are players helping on the offense but have a negative impact on the defense, that’s why Miami Heats attacked Kemba in the Eastern Final. Players like Buddy Hield and Devin Booker can learn from Chris Paul, who is also a small size guard, but can contribute defensively. Patrick Beverley has almost zero impact on the offense, but his defense changes the game, interestingly, Ben Simmons, a widely considered next LeBron, is in the same group as Patrick Beverley, Ben needs to start shooting threes to help more on the offense, instead of just pushing the transitions.
Player Efficiency Rating(PER) and True Shooting Percentage(TS%) are an all in one number to evaluate a player’s contribution and players efficiency in shooting. PER is to measure player’s per-minute performance with a league average is 15.0, while TS% takes free-throw and three-point field goal percentage into consideration. Here I use these two stats as an indicator of player’s efficiency on the offensive end.
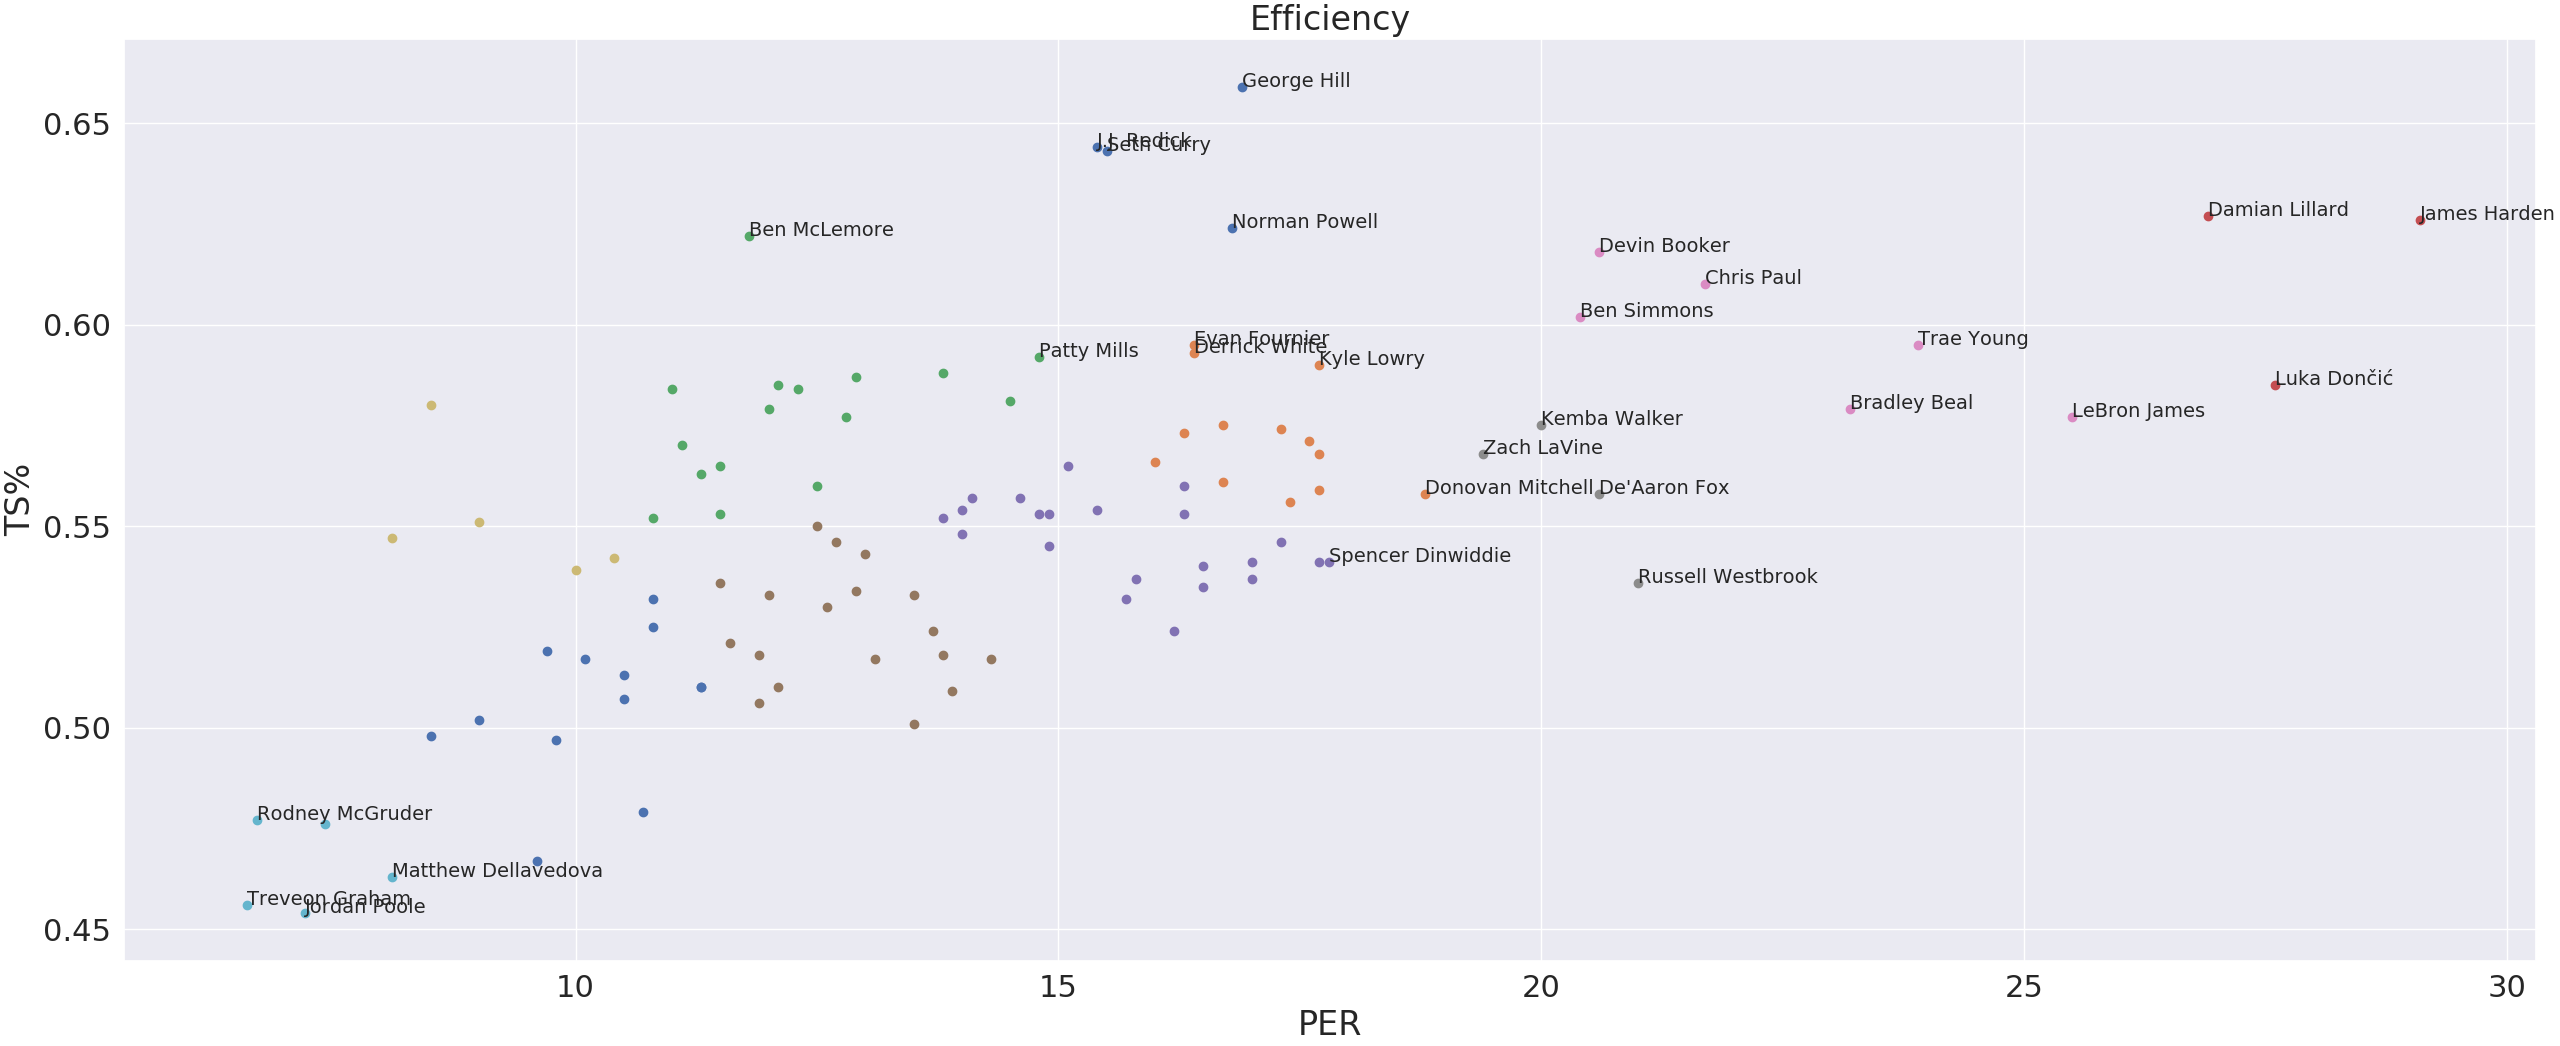
James Harden, no doubt, is in the elite group together with Damian Lillard and Luka. Devin Booker is an elite attacker considering how many shoots he has to take while maintaining such a high TS%.
Besides the efficiency, how heavy the player is involved in the game should also be considered. Usage Percentage generally estimates the team’s possessions used by a player (of course while he is on the court), like field goal attempt, shooting foul draw, or turnovers. Turnover percentage just one sub-field of usage percentage.
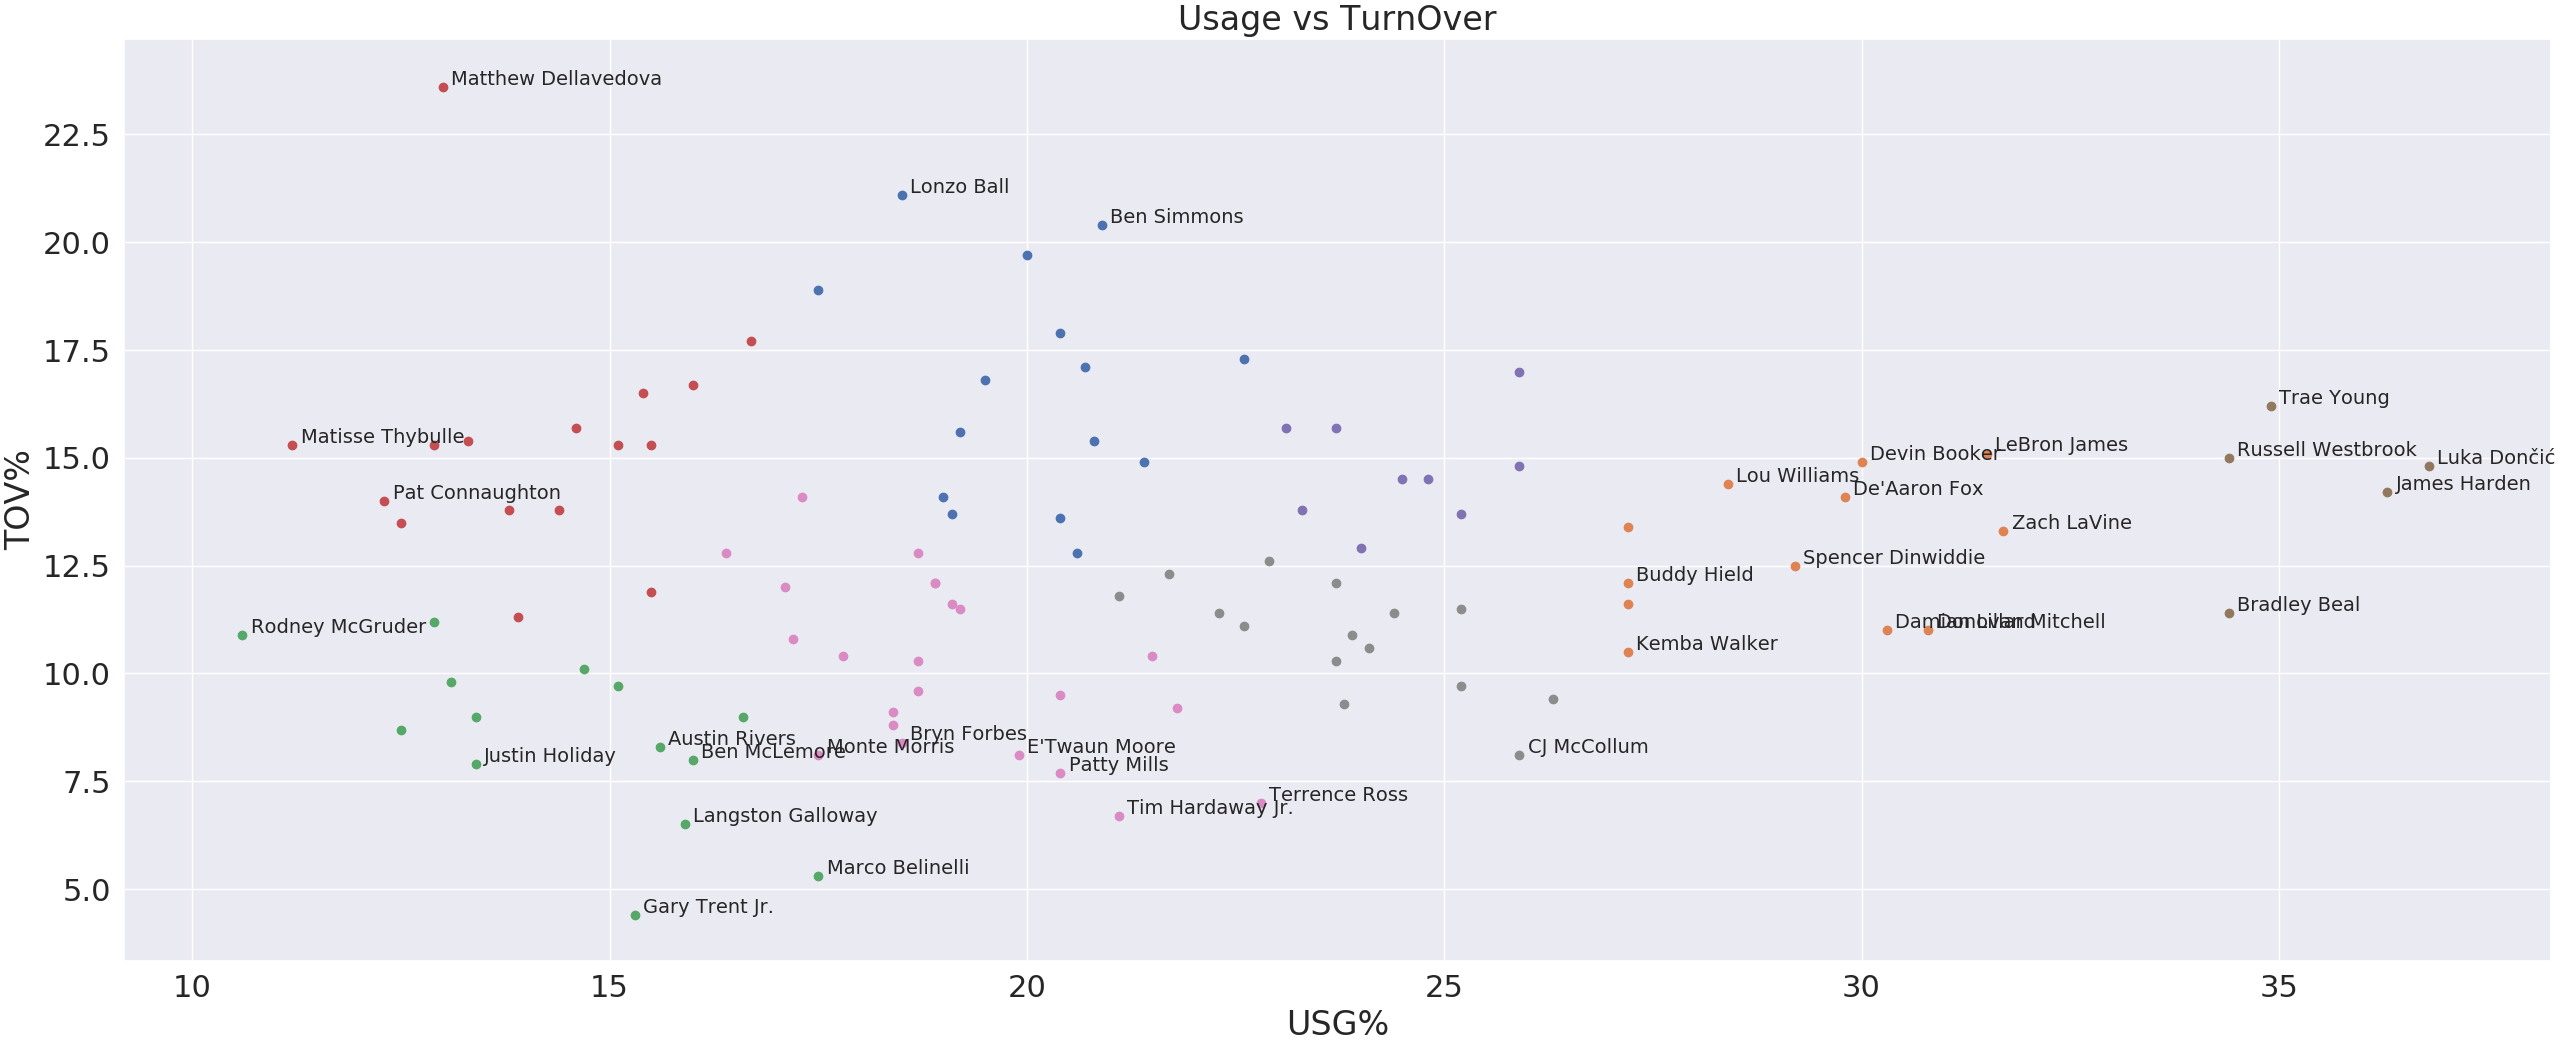
James Harden, Trae Young, Russ, Luka and Bradley need the ball at their hand. James and Russ take more than 70% percent of the possessions when they are on court (but considering the time they are both on the court, the actual possessions ended up with them is less than 70%, but still a large number), which matches Rockets game strategy, ISO. Matthew Dellavedova, man, you should take care of the ball.
Tov% vs Ast%
When talking about turnover, people think about assists, the Assist Percentage estimates teammate field goals assisted by the player.
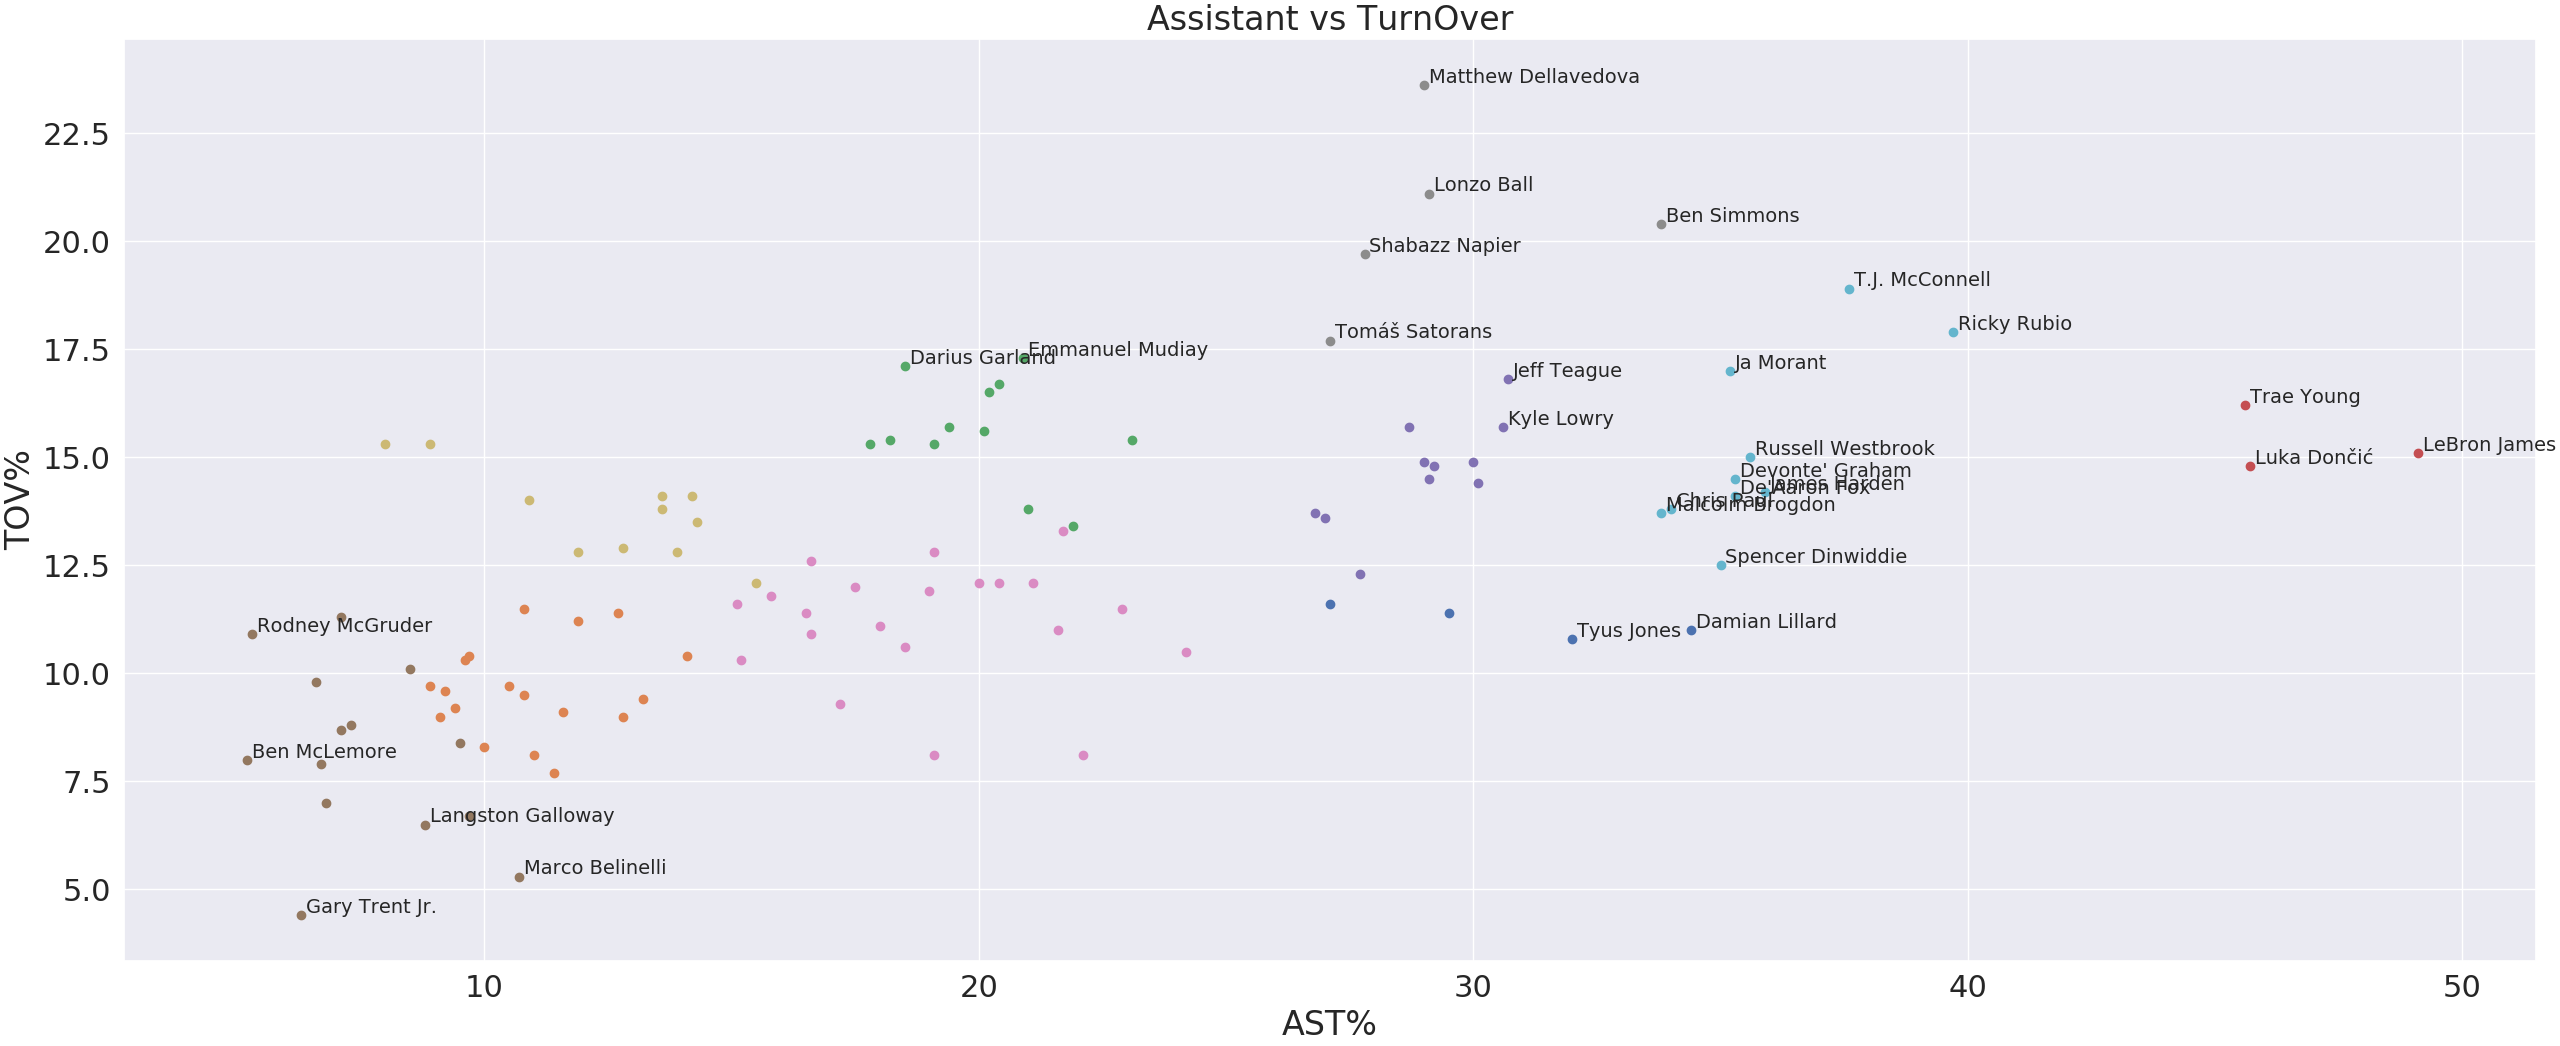
Trae, Luka, and Lebron have the highest assist percentage, they organize the games. Wonder why James Harden is not on the list, take a closer look (sorry I did not organize the text well), James and Russ have similar AST%, which probably means these two together drive the rockets plays, in another word, James shares a portion of his ball to Russ, otherwise, I believe James will have larger than 50% AST%.
Lonzo Ball and Ben Simmons, even though they are good at finding the opportunities, but need to reduce the turnovers.
Last, let’s look at rebound rate, showing how effective a player is gaining rebound, offensively and defensively.
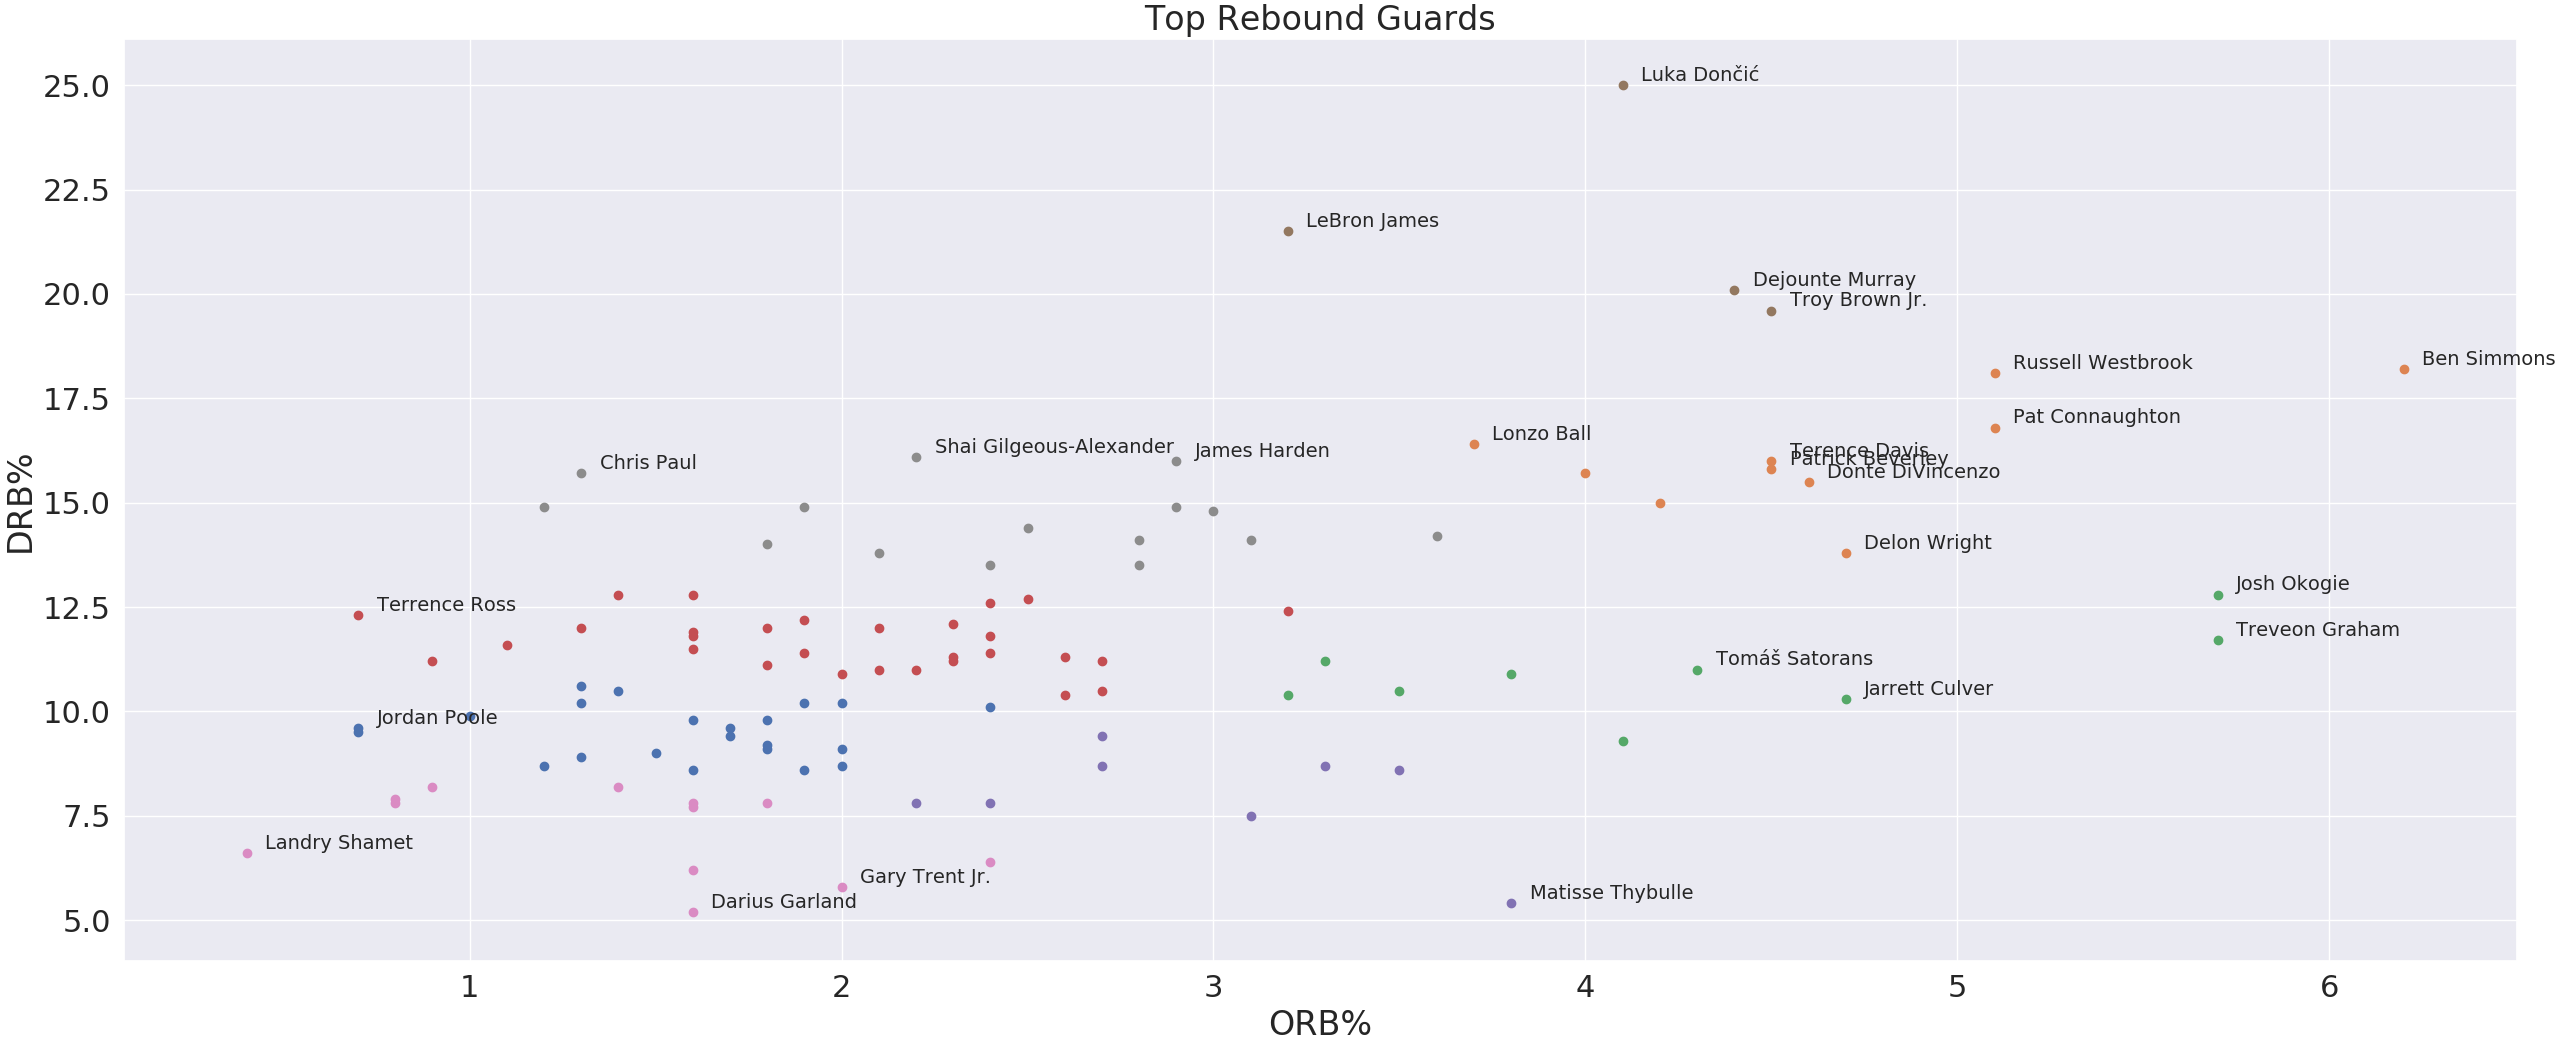
Ben Simmons has the highest offensive rebound rate (I did not really watch his game, thus this kind of new to me). Luka has the highest defensive rebound rate (thus he has so much triple-double), probably due to team strategy, big guys will box out and guards will collect the rebound, one good thing about guards getting defensive rebound is he can start the transition offense right away, Jason Kidd does this a lot.
After seeing guards’ advanced stats in the 2019-2020 seasons. Some takeaways:
- Luka Doncic has joined James Harden and LeBron James becoming the best guards right now. Only in his second year!
- Damian Lillard and James Harden are unstoppable on the offensive end, and surprisingly James Harden is also a good defender!
- Chris Paul is old, but he is still a top guard, better than Donovan Mitchell
- Trae Young, Bradley Beal, and Devin Booker are solid in offense but can improve in defense
- Ben Simmons is kind of similar to Russell Westbrook, can enlarge his offensive impact in the game by shooting better.